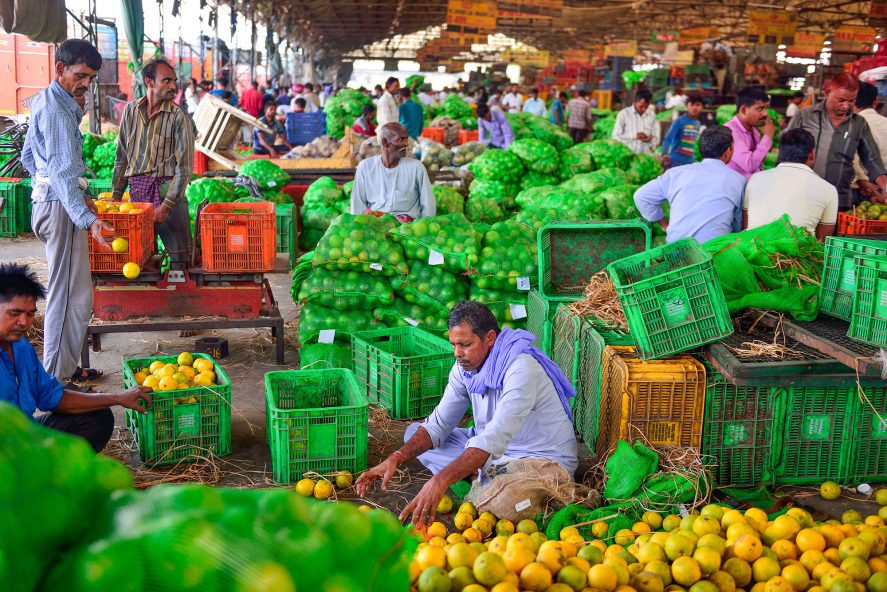
In November 2020, tens of thousands of farmers, mostly from Punjab and Haryana, flooded the streets of New Delhi holding signs that read “No Farmer No Food” and chanting “Dharti Mata Ki Jai.” Makeshift camps lined the outskirts of the city where food was cooked over small gas fires and nights were spent sleeping on mattresses strategically positioned underneath tractors.
Such scenes were a reaction to the passage of three agricultural reform bills by the central government that aimed to minimize the role of Agricultural Produce Market Committee (APMC) markets as the sole marketing platform for farmers and remove restrictions on the sale of agricultural goods. Since the 1960s, Indian farmers have relied heavily on state-run APMC markets, or mandis, and Minimum Support Prices (MSPs) to provide infrastructural capacity and ensure fair prices to farmers. But the passage of these bills has sparked fear over the demise of the APMC system and subsequent exploitation by corporations.
These events underscore the importance of mandis as physical sites of exchange and trade within India’s broader agricultural marketing system, so I set out to understand the spatial distribution of such spot markets in India. As agriculture falls under the purview of the state government, each state has charted its own agricultural development path; therefore, adopting a spatial lens exposes significant regional variation. The resulting maps not only serve to describe various market features, but elicit more questions about the characteristics of places, the relationships between them, and the underlying stories behind them. Presented here is one particular piece of the narrative; for a deeper dive into the spatial characteristics of mandis in India, look out for the upcoming full report that provides a stronger background on India’s agricultural marketing system and explores additional market attributes across different geographic scales.
Setting up the Data
The process that went into creating these maps was multipart and laborious. First, using an intricate python script, we scraped data from the Agmarknet website, a portal run and maintained by the Ministry of Agriculture and Farmers Welfare, into state-wise excel spreadsheets. Using Stata, I appended, cleaned, and transformed this data into a national-level dataset equipped with the relevant variables for analysis. Then, I used India shapefiles at both the state and district levels to overlay the data spatially.
However, in order to join the data cleaned in Stata with the ArcGIS shapefiles, I had to ensure that they both shared a unique ID. Given the varied reference dates of the different sources (2011-2015 for Agmarknet and 2020 for the shapefiles), there were a number of naming inconsistencies due to district splits, name changes, and translation discrepancies. After some investigative work into the rapidly shifting district boundaries in India, I wrote code in Stata to match the two sources. The cleaned dataset was now ready to be joined with the shapefiles and the map-making could finally commence.
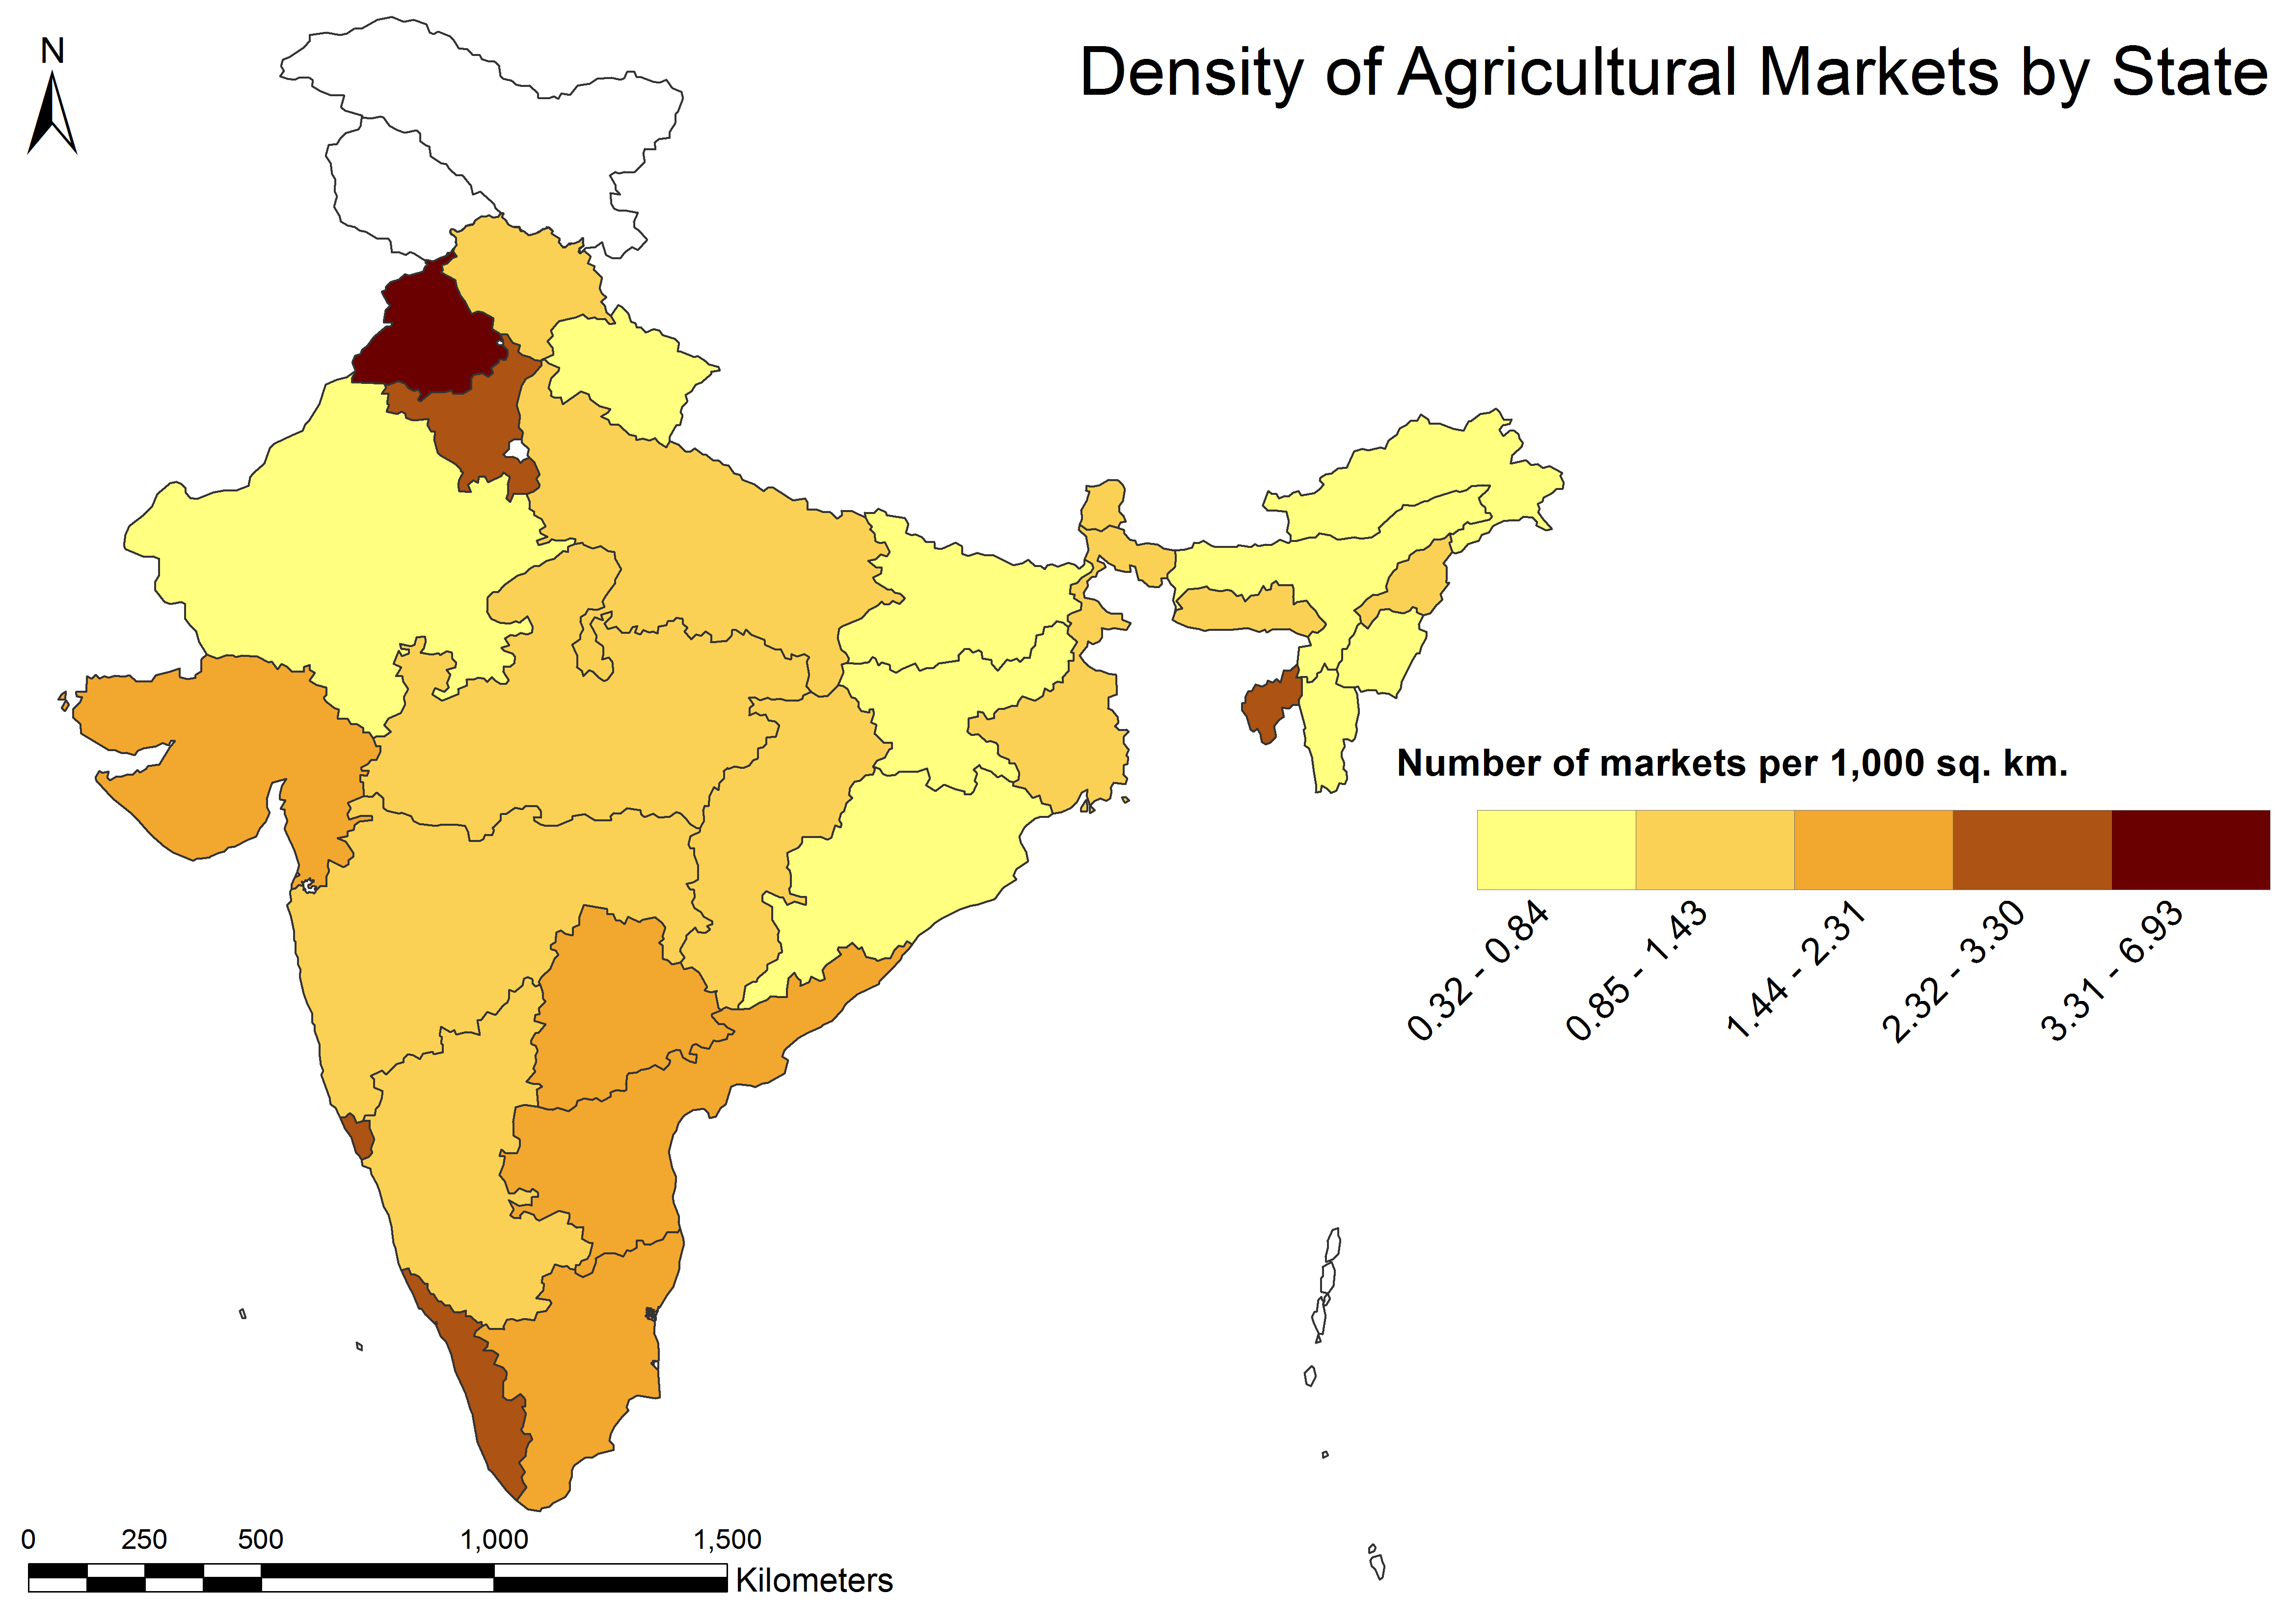
Market Density in India
In conducting this analysis, one set of maps that has fascinated me is that of market density in India, as presented above. This was calculated by dividing the number of markets per state (or district) reported in the Agmarknet portal by the total area in square kilometers of each state (or district). As evident through the state map, Punjab (in the northwest region) has an overwhelmingly high density of mandis relative to all other states in India. In numbers, it has 6.9 mandis per 1,000 square kilometers compared to the next highest market density of 3.3 mandis per 1,000 square kilometers in the neighboring state of Haryana. This considerable concentration of mandis in Punjab aligns with its title as the “granary of India.” Arunachal Pradesh, Assam, Manipur, and Mizoram (in the northeast region) lie at the other end of the spectrum with notably low densities of agricultural markets, averaging at 0.6 mandis per 1,000 square kilometers.
See Tables below for data in table form.
Coordinate System: GCS WGS 1984
Data Source: Agmarknet
The spatial trends revealed here map directly onto India’s experience during the Green Revolution, with each state undertaking a radically different trajectory through structural transformation. States that predominantly grow wheat and rice – namely Punjab and Haryana – and have benefitted from the modernization of agriculture have the highest market densities today. Greater levels of commercialization, and thus linkages to markets, also spurred economic development in these states. In contrast, low uptake of productivity-enhancing technologies in the northeastern states resulted in low agricultural growth and is reflected in lower market densities in these areas.
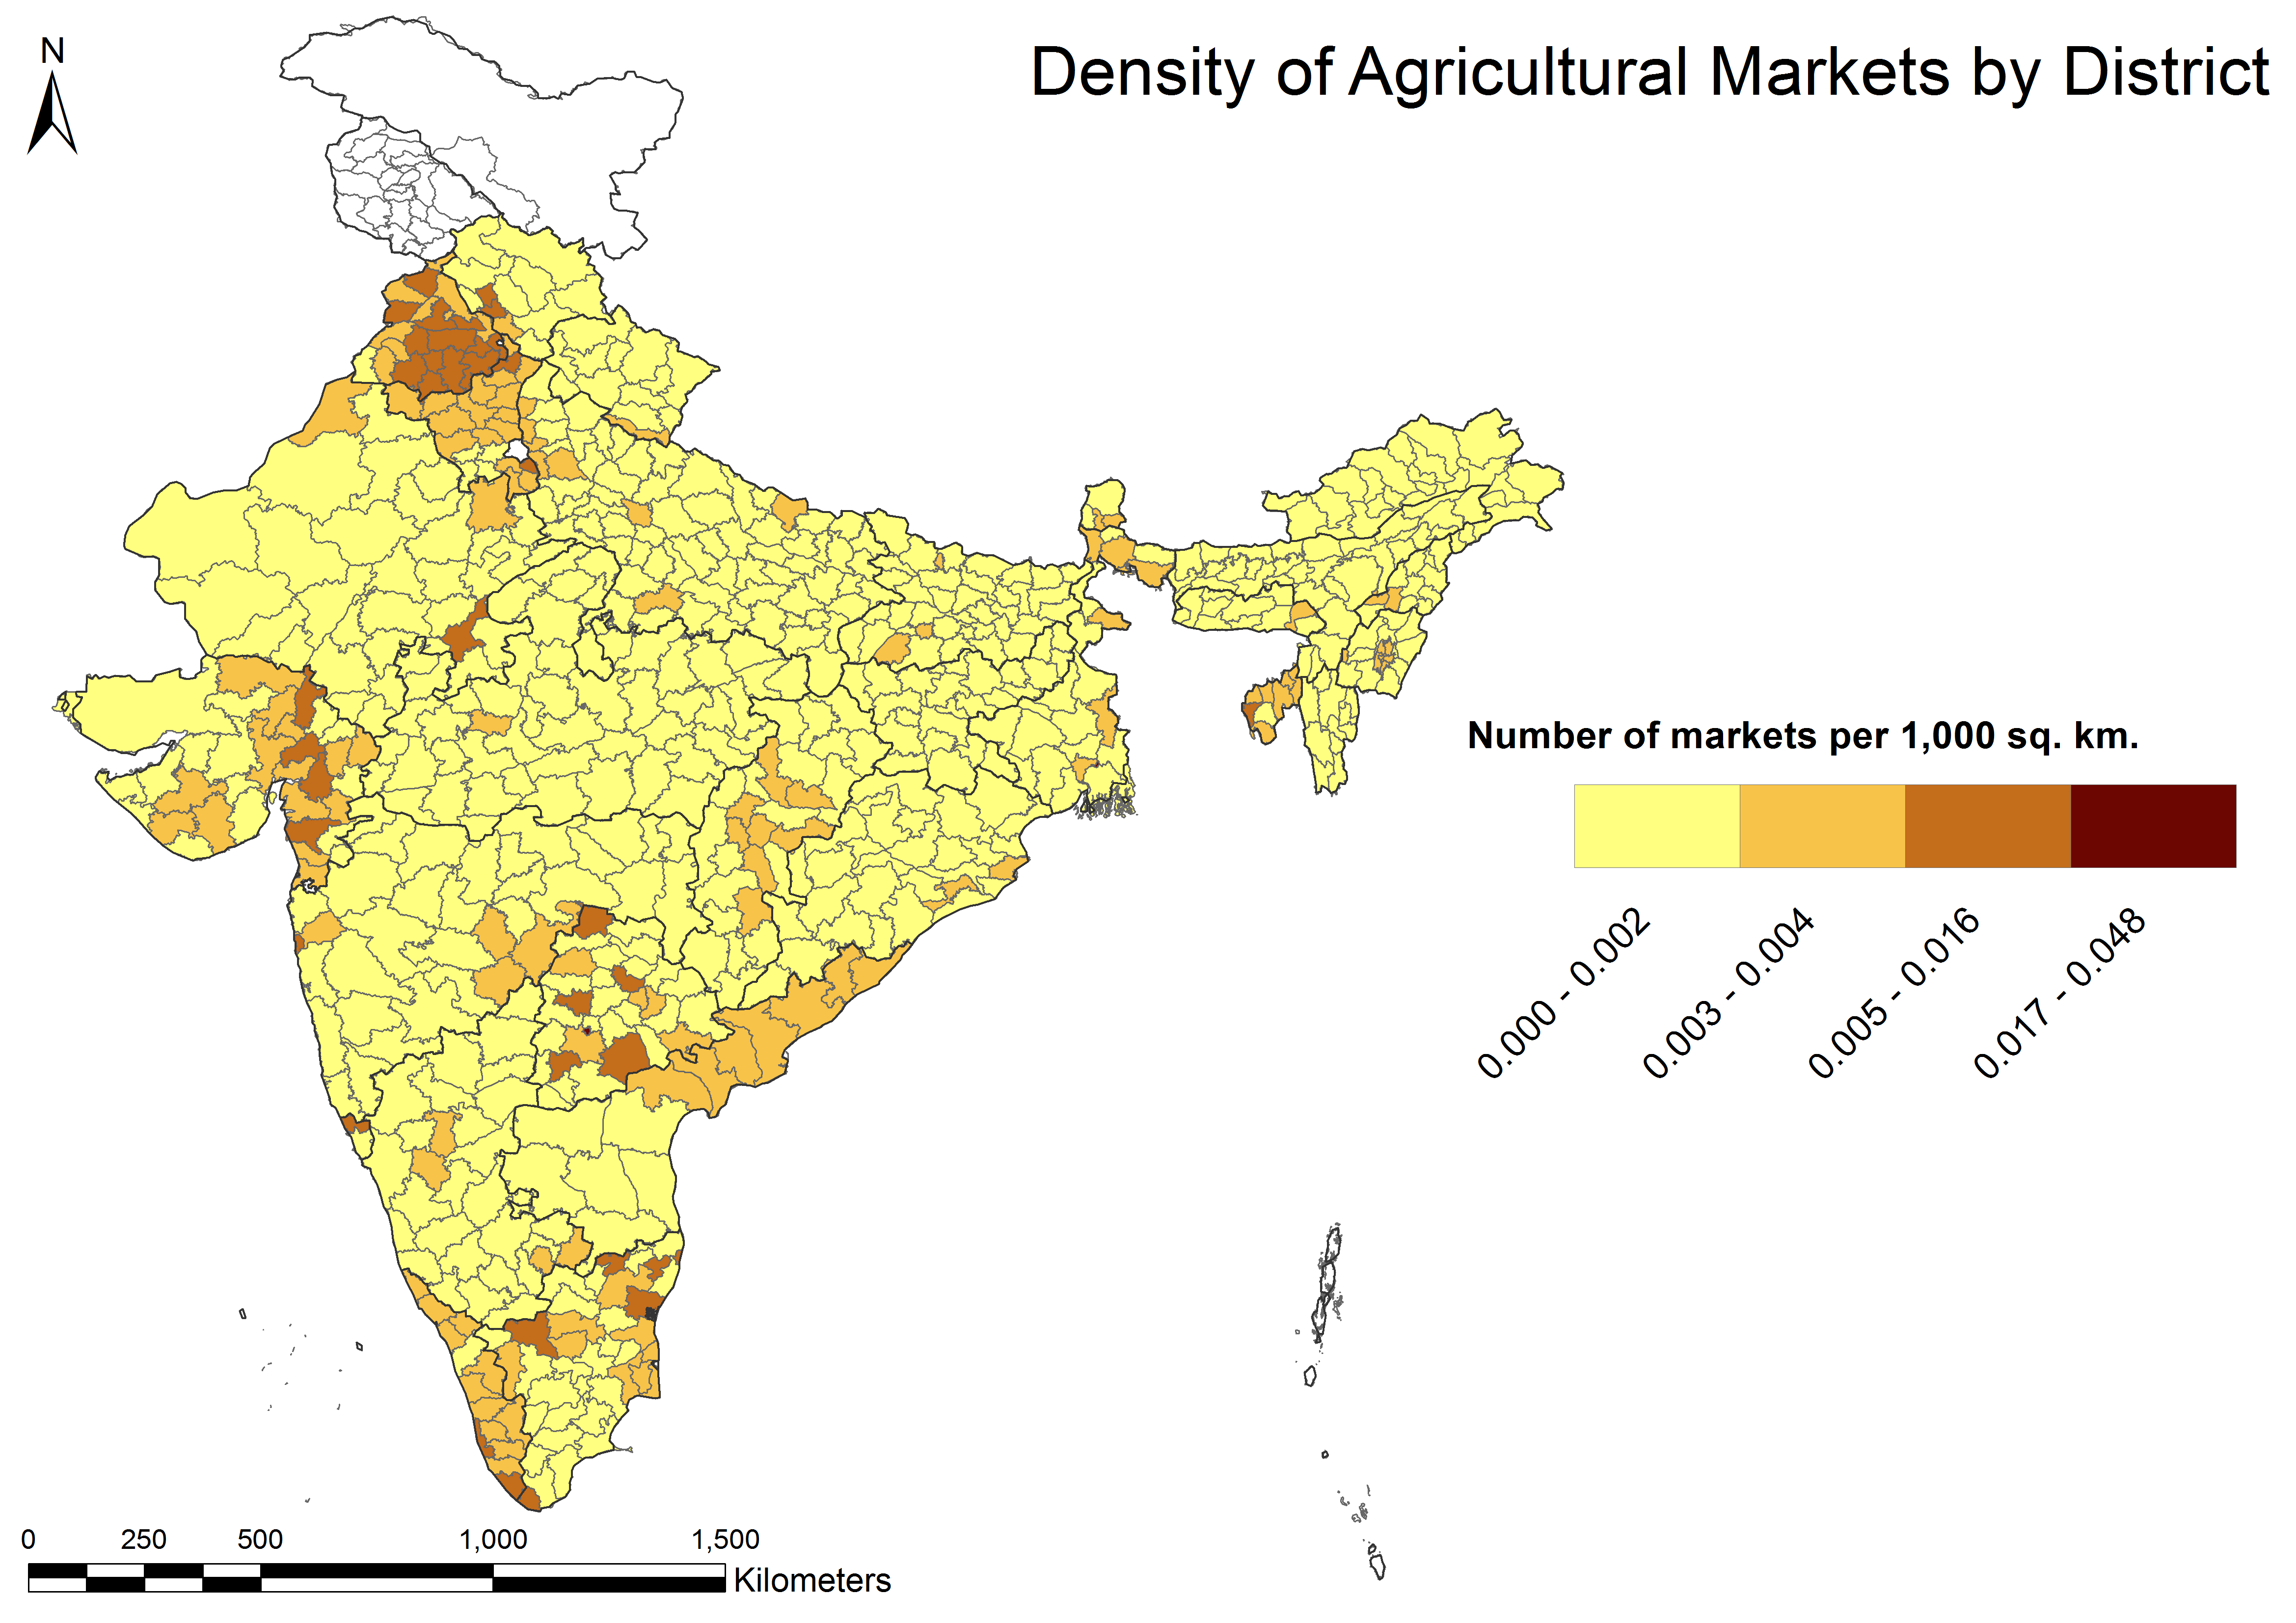
Even within states, there is substantial variation in the prevalence of mandis, as seen in the market density by district map. One interesting example appears in the southeastern state of Andhra Pradesh where the delta region (northern coast) has a visibly higher density of markets relative to the southern region. This can be explained by the West Godavari, East Godavari, and Krishna districts, which produce the most rice not only in the state, but in the entire country.
See Tables below for data in table format.
Coordinate System: GCS WGS 1984
Data Source: Agmarknet
These simple yet powerful maps inspire further exploration into how market density relates to broader agricultural, economic, and social development in India. They beg a probe into the impact of market density on dietary diversity and provoke the study of the relationship between mandi concentration and the viability of farmer producer organizations. Understanding the current spatial landscape is a crucial first step towards addressing these questions of agricultural, economic, and social interconnectedness.
Bhavna Sivasubramanian is a 2021 TCI summer intern and a graduate student at Cornell University pursuing a Master of Regional Planning degree with a concentration in international development planning. She aims to ultimately work in India on issues surrounding urban informality and aspires to engage with local networks, coalitions, and federations towards this mission.
Tables
Density of Agricultural Markets by State
| State |
Number of markets per 1,000 sq. km |
| Arunanchal Pradesh |
0.32 – 0.84 |
| Jharkhand |
0.32 – 0.84 |
| Assam |
0.32 – 0.84 |
| Andaman & Nicobar Island |
0.32 – 0.84 |
| Uttarakhand |
0.32 – 0.84 |
| Bihar |
0.32 – 0.84 |
| Odisha |
0.32 – 0.84 |
| Manipur |
0.32 – 0.84 |
| Mizoram |
0.32 – 0.84 |
| Rajasthan |
0.32 – 0.84 |
| Himachal Pradesh |
0.85 – 1.43 |
| Meghalaya |
0.85 – 1.43 |
| Madhya Pradesh |
0.85 – 1.43 |
| Uttar Pradesh |
0.85 – 1.43 |
| Karnataka |
0.85 – 1.43 |
| West Bengal |
0.85 – 1.43 |
| Maharashtra |
0.85 – 1.43 |
| Sikkim |
0.85 – 1.43 |
| Nagaland |
0.85 – 1.43 |
| Chhattisgarh |
0.85 – 1.43 |
| Andhra Pradesh |
1.44 – 2.31 |
| Tamil Nadu |
1.44 – 2.31 |
| Gujarat |
1.44 – 2.31 |
| Dadra and Nagar Haveli and Daman and Diu |
1.44 – 2.31 |
| Telangana |
1.44 – 2.31 |
| Goa |
2.32 – 3.30 |
| Tripura |
2.32 – 3.30 |
| Kerala |
2.32 – 3.30 |
| Haryana |
2.32 – 3.30 |
| Punjab |
3.31 – 6.93 |
Density of Agricultural Markets by District
| District |
Number of markets per 1,000 sq. km |
| Leh |
0.000 – 0.002 |
| Jaisalmer |
0.000 – 0.002 |
| Lahaul and Spiti |
0.000 – 0.002 |
| Barmer |
0.000 – 0.002 |
| Upper Dibang Valley |
0.000 – 0.002 |
| Kishtwar |
0.000 – 0.002 |
| Uttarkashi |
0.000 – 0.002 |
| Chamoli |
0.000 – 0.002 |
| Kargil |
0.000 – 0.002 |
| Pithoragarh |
0.000 – 0.002 |
| Chamba |
0.000 – 0.002 |
| Karbi Anglong |
0.000 – 0.002 |
| Ratnagiri |
0.000 – 0.002 |
| Upper Siang |
0.000 – 0.002 |
| Kinnaur |
0.000 – 0.002 |
| West Singhbhum |
0.000 – 0.002 |
| Anjaw |
0.000 – 0.002 |
| Upper Subansiri |
0.000 – 0.002 |
| Bhadradri Kothagudem |
0.000 – 0.002 |
| Pauri Garhwal |
0.000 – 0.002 |
| Nagarkurnool |
0.000 – 0.002 |
| Muzaffarabad |
0.000 – 0.002 |
| Singrauli |
0.000 – 0.002 |
| West Kameng |
0.000 – 0.002 |
| Changlang |
0.000 – 0.002 |
| Gumla |
0.000 – 0.002 |
| Karauli |
0.000 – 0.002 |
| Sirohi |
0.000 – 0.002 |
| Punch |
0.000 – 0.002 |
| Gaya |
0.000 – 0.002 |
| Dima Hasao |
0.000 – 0.002 |
| Giridih |
0.000 – 0.002 |
| Palghar |
0.000 – 0.002 |
| Yadgir |
0.000 – 0.002 |
| Sidhi |
0.000 – 0.002 |
| Rajsamand |
0.000 – 0.002 |
| East Kameng |
0.000 – 0.002 |
| Kurung Kumey |
0.000 – 0.002 |
| Sindhudurg |
0.000 – 0.002 |
| Mirpur |
0.000 – 0.002 |
| Umaria |
0.000 – 0.002 |
| North Sikkim |
0.000 – 0.002 |
| Tiruppur |
0.000 – 0.002 |
| Banswara |
0.000 – 0.002 |
| Palamu |
0.000 – 0.002 |
| Tehri Garhwal |
0.000 – 0.002 |
| Azamgarh |
0.000 – 0.002 |
| Latehar |
0.000 – 0.002 |
| Komaram Bheem |
0.000 – 0.002 |
| Sangareddy |
0.000 – 0.002 |
| Garhwa |
0.000 – 0.002 |
| Tinsukia |
0.000 – 0.002 |
| Mulugu |
0.000 – 0.002 |
| West Khasi Hills |
0.000 – 0.002 |
| Lower Dibang Valley |
0.000 – 0.002 |
| Cachar |
0.000 – 0.002 |
| Kandhamal |
0.000 – 0.002 |
| Dumka |
0.000 – 0.002 |
| Dungarpur |
0.000 – 0.002 |
| Chikkaballapura |
0.000 – 0.002 |
| Chatra |
0.000 – 0.002 |
| Siang |
0.000 – 0.002 |
| Golaghat |
0.000 – 0.002 |
| Mancherial |
0.000 – 0.002 |
| Narayanpur |
0.000 – 0.002 |
| South 24 Parganas |
0.000 – 0.002 |
| Sonitpur |
0.000 – 0.002 |
| Dibrugarh |
0.000 – 0.002 |
| Almora |
0.000 – 0.002 |
| Nirmal |
0.000 – 0.002 |
| Sonbhadra |
0.000 – 0.002 |
| Kamareddy |
0.000 – 0.002 |
| Kaimur |
0.000 – 0.002 |
| Siddipet |
0.000 – 0.002 |
| Vikarabad |
0.000 – 0.002 |
| Suryapet |
0.000 – 0.002 |
| Muzaffarpur |
0.000 – 0.002 |
| Koriya |
0.000 – 0.002 |
| Kokrajhar |
0.000 – 0.002 |
| Betul |
0.000 – 0.002 |
| Aravalli |
0.000 – 0.002 |
| Rajouri |
0.000 – 0.002 |
| Tamenglong |
0.000 – 0.002 |
| West Karbi Anglong |
0.000 – 0.002 |
| Lakhimpur |
0.000 – 0.002 |
| Sundargarh |
0.000 – 0.002 |
| Dholpur |
0.000 – 0.002 |
| Jamui |
0.000 – 0.002 |
| Bandipora |
0.000 – 0.002 |
| Katihar |
0.000 – 0.002 |
| Ramanagara |
0.000 – 0.002 |
| Banka |
0.000 – 0.002 |
| Mamit |
0.000 – 0.002 |
| Dakshin Bastar Dantewada |
0.000 – 0.002 |
| Tapi |
0.000 – 0.002 |
| Jhargram |
0.000 – 0.002 |
| Kushinagar |
0.000 – 0.002 |
| Yadadri Bhuvanagiri |
0.000 – 0.002 |
| Churu |
0.000 – 0.002 |
| Kutch |
0.000 – 0.002 |
| Agar Malwa |
0.000 – 0.002 |
| Basti |
0.000 – 0.002 |
| Alipurduar |
0.000 – 0.002 |
| Kallakurichi |
0.000 – 0.002 |
| Shi Yomi |
0.000 – 0.002 |
| Doda |
0.000 – 0.002 |
| Saran |
0.000 – 0.002 |
| West Champaran |
0.000 – 0.002 |
| Bijapur |
0.000 – 0.002 |
| Jalore |
0.000 – 0.002 |
| Jayashankar Bhupalapally |
0.000 – 0.002 |
| Surajpur |
0.000 – 0.002 |
| Jagtial |
0.000 – 0.002 |
| Malkangiri |
0.000 – 0.002 |
| Dhemaji |
0.000 – 0.002 |
| Jodhpur |
0.000 – 0.002 |
| Ganjam |
0.000 – 0.002 |
| Saraikela-Kharsawan |
0.000 – 0.002 |
| Chandauli |
0.000 – 0.002 |
| Khunti |
0.000 – 0.002 |
| Nabarangapur |
0.000 – 0.002 |
| Sultanpur |
0.000 – 0.002 |
| Lalitpur |
0.000 – 0.002 |
| Baksa |
0.000 – 0.002 |
| Tenkasi |
0.000 – 0.002 |
| Nawada |
0.000 – 0.002 |
| Karur |
0.000 – 0.002 |
| Reasi |
0.000 – 0.002 |
| Katni |
0.000 – 0.002 |
| Tawang |
0.000 – 0.002 |
| Bhojpur |
0.000 – 0.002 |
| Bageshwar |
0.000 – 0.002 |
| Churachandpur |
0.000 – 0.002 |
| Ribhoi |
0.000 – 0.002 |
| Mandla |
0.000 – 0.002 |
| Moradabad |
0.000 – 0.002 |
| Nalanda |
0.000 – 0.002 |
| Kra Daadi |
0.000 – 0.002 |
| Jogulamba Gadwal |
0.000 – 0.002 |
| Nagaur |
0.000 – 0.002 |
| Kamjong |
0.000 – 0.002 |
| Chengalpattu |
0.000 – 0.002 |
| Siwan |
0.000 – 0.002 |
| Rayagada |
0.000 – 0.002 |
| Godda |
0.000 – 0.002 |
| Gadchiroli |
0.000 – 0.002 |
| Sitamarhi |
0.000 – 0.002 |
| Champhai |
0.000 – 0.002 |
| Mirzapur |
0.000 – 0.002 |
| Mon |
0.000 – 0.002 |
| Tuensang |
0.000 – 0.002 |
| Rudraprayag |
0.000 – 0.002 |
| Nilgiris |
0.000 – 0.002 |
| Sahibganj |
0.000 – 0.002 |
| Hazaribagh |
0.000 – 0.002 |
| Ukhrul |
0.000 – 0.002 |
| Bikaner |
0.000 – 0.002 |
| Korba |
0.000 – 0.002 |
| Narayanpet |
0.000 – 0.002 |
| Jorhat |
0.000 – 0.002 |
| Chandel |
0.000 – 0.002 |
| Pherzawl |
0.000 – 0.002 |
| Jhunjhunu |
0.000 – 0.002 |
| Gopalganj |
0.000 – 0.002 |
| Udalguri |
0.000 – 0.002 |
| East Champaran |
0.000 – 0.002 |
| Peddapalli |
0.000 – 0.002 |
| Shrawasti |
0.000 – 0.002 |
| Pratapgarh |
0.000 – 0.002 |
| Vaishali |
0.000 – 0.002 |
| Kishanganj |
0.000 – 0.002 |
| Goalpara |
0.000 – 0.002 |
| Dhanbad |
0.000 – 0.002 |
| South Andaman |
0.000 – 0.002 |
| Barabanki |
0.000 – 0.002 |
| Pakke Kessang |
0.000 – 0.002 |
| Chirang |
0.000 – 0.002 |
| Jharsuguda |
0.000 – 0.002 |
| Papum Pare |
0.000 – 0.002 |
| Lawngtlai |
0.000 – 0.002 |
| East Jaintia Hills |
0.000 – 0.002 |
| Wanaparthy |
0.000 – 0.002 |
| Koraput |
0.000 – 0.002 |
| Gajapati |
0.000 – 0.002 |
| Saiha |
0.000 – 0.002 |
| Dindori |
0.000 – 0.002 |
| Shahdol |
0.000 – 0.002 |
| Lower Siang |
0.000 – 0.002 |
| Prayagraj |
0.000 – 0.002 |
| Karimganj |
0.000 – 0.002 |
| Biswanath |
0.000 – 0.002 |
| Nayagarh |
0.000 – 0.002 |
| Simdega |
0.000 – 0.002 |
| Nuapada |
0.000 – 0.002 |
| Pakur |
0.000 – 0.002 |
| Pali |
0.000 – 0.002 |
| Jamtara |
0.000 – 0.002 |
| Ganderbal |
0.000 – 0.002 |
| Gir Somnath |
0.000 – 0.002 |
| Senapati |
0.000 – 0.002 |
| Lunglei |
0.000 – 0.002 |
| Mathura |
0.000 – 0.002 |
| East Singhbhum |
0.000 – 0.002 |
| East Siang |
0.000 – 0.002 |
| Sawai Madhopur |
0.000 – 0.002 |
| Tirupathur |
0.000 – 0.002 |
| Saharsa |
0.000 – 0.002 |
| Buxar |
0.000 – 0.002 |
| Sheopur |
0.000 – 0.002 |
| Sant Kabir Nagar |
0.000 – 0.002 |
| Peren |
0.000 – 0.002 |
| East Garo Hills |
0.000 – 0.002 |
| Mayurbhanj |
0.000 – 0.002 |
| Chhota Udaipur |
0.000 – 0.002 |
| Rajanna Sircilla |
0.000 – 0.002 |
| Ranchi |
0.000 – 0.002 |
| Ranipet |
0.000 – 0.002 |
| Chamarajanagara |
0.000 – 0.002 |
| Sivasagar |
0.000 – 0.002 |
| Darrang |
0.000 – 0.002 |
| Sikar |
0.000 – 0.002 |
| Koderma |
0.000 – 0.002 |
| Chitrakoot |
0.000 – 0.002 |
| Kangpokpi |
0.000 – 0.002 |
| Dhubri |
0.000 – 0.002 |
| Rewa |
0.000 – 0.002 |
| Unnao |
0.000 – 0.002 |
| Morigaon |
0.000 – 0.002 |
| Burhanpur |
0.000 – 0.002 |
| Balangir |
0.000 – 0.002 |
| Lower Subansiri |
0.000 – 0.002 |
| Purulia |
0.000 – 0.002 |
| Khagaria |
0.000 – 0.002 |
| Perambalur |
0.000 – 0.002 |
| Banda |
0.000 – 0.002 |
| Hojai |
0.000 – 0.002 |
| Thiruvallur |
0.000 – 0.002 |
| Charkhi Dadri |
0.000 – 0.002 |
| Kalahandi |
0.000 – 0.002 |
| Lohardaga |
0.000 – 0.002 |
| Boudh |
0.000 – 0.002 |
| Bundi |
0.000 – 0.002 |
| South West Khasi Hills |
0.000 – 0.002 |
| Damoh |
0.000 – 0.002 |
| West Siang |
0.000 – 0.002 |
| Khandwa |
0.000 – 0.002 |
| Araria |
0.000 – 0.002 |
| Neemuch |
0.000 – 0.002 |
| Bokaro |
0.000 – 0.002 |
| Chhindwara |
0.000 – 0.002 |
| Munger |
0.000 – 0.002 |
| Panna |
0.000 – 0.002 |
| Nicobars |
0.000 – 0.002 |
| Ramban |
0.000 – 0.002 |
| Namsai |
0.000 – 0.002 |
| Deogarh |
0.000 – 0.002 |
| Kulgam |
0.000 – 0.002 |
| North and Middle Andaman |
0.000 – 0.002 |
| Ayodhya |
0.000 – 0.002 |
| Gonda |
0.000 – 0.002 |
| Ramgarh |
0.000 – 0.002 |
| Jajpur |
0.000 – 0.002 |
| Jaunpur |
0.000 – 0.002 |
| Dhule |
0.000 – 0.002 |
| Samastipur |
0.000 – 0.002 |
| Lakhimpur Kheri |
0.000 – 0.002 |
| Kamle |
0.000 – 0.002 |
| Bankura |
0.000 – 0.002 |
| Devbhumi Dwarka |
0.000 – 0.002 |
| Kolasib |
0.000 – 0.002 |
| Pudukkottai |
0.000 – 0.002 |
| Nagaon |
0.000 – 0.002 |
| Kendujhar |
0.000 – 0.002 |
| Hailakandi |
0.000 – 0.002 |
| Niwari |
0.000 – 0.002 |
| Thoothukkudi |
0.000 – 0.002 |
| Udhampur |
0.000 – 0.002 |
| Lucknow |
0.000 – 0.002 |
| Lohit |
0.000 – 0.002 |
| Deoria |
0.000 – 0.002 |
| Rohtas |
0.000 – 0.002 |
| Darbhanga |
0.000 – 0.002 |
| Sambalpur |
0.000 – 0.002 |
| Purba Medinipur |
0.000 – 0.002 |
| Hardoi |
0.000 – 0.002 |
| Satna |
0.000 – 0.002 |
| West Sikkim |
0.000 – 0.002 |
| Supaul |
0.000 – 0.002 |
| Deoghar |
0.000 – 0.002 |
| Lakhisarai |
0.000 – 0.002 |
| Mahisagar |
0.000 – 0.002 |
| Anuppur |
0.000 – 0.002 |
| Noney |
0.000 – 0.002 |
| Sukma |
0.000 – 0.002 |
| Malda |
0.000 – 0.002 |
| Madhubani |
0.000 – 0.002 |
| Ambedkar Nagar |
0.000 – 0.002 |
| Kiphire |
0.000 – 0.002 |
| Hapur |
0.000 – 0.002 |
| North Garo Hills |
0.000 – 0.002 |
| Raisen |
0.000 – 0.002 |
| Morbi |
0.000 – 0.002 |
| Vijayapura |
0.000 – 0.002 |
| Bhilwara |
0.000 – 0.002 |
| Barpeta |
0.000 – 0.002 |
| Baran |
0.000 – 0.002 |
| Gwalior |
0.000 – 0.002 |
| Kolhapur |
0.000 – 0.002 |
| Gorakhpur |
0.000 – 0.002 |
| Tengnoupal |
0.000 – 0.002 |
| Amethi |
0.000 – 0.002 |
| Serchhip |
0.000 – 0.002 |
| Anantapur |
0.000 – 0.002 |
| Tirap |
0.000 – 0.002 |
| Kalimpong |
0.000 – 0.002 |
| Bongaigaon |
0.000 – 0.002 |
| Chittorgarh |
0.000 – 0.002 |
| Rae Bareli |
0.000 – 0.002 |
| Jhabua |
0.000 – 0.002 |
| Balaghat |
0.000 – 0.002 |
| Charaideo |
0.000 – 0.002 |
| Bareilly |
0.000 – 0.002 |
| Khargone |
0.000 – 0.002 |
| Samba |
0.000 – 0.002 |
| Mahoba |
0.000 – 0.002 |
| Chhatarpur |
0.000 – 0.002 |
| Kanpur Dehat |
0.000 – 0.002 |
| Kannauj |
0.000 – 0.002 |
| Nalbari |
0.000 – 0.002 |
| Nainital |
0.000 – 0.002 |
| Raichur |
0.000 – 0.002 |
| Alirajpur |
0.000 – 0.002 |
| Chitradurga |
0.000 – 0.002 |
| Kamrup |
0.000 – 0.002 |
| Seoni |
0.000 – 0.002 |
| Khawzawl |
0.000 – 0.002 |
| Dhenkanal |
0.000 – 0.002 |
| Tonk |
0.000 – 0.002 |
| Jhalawar |
0.000 – 0.002 |
| Hanumangarh |
0.000 – 0.002 |
| Kupwara |
0.000 – 0.002 |
| Kullu |
0.000 – 0.002 |
| Bahraich |
0.000 – 0.002 |
| Udupi |
0.000 – 0.002 |
| Solapur |
0.000 – 0.002 |
| Barwani |
0.000 – 0.002 |
| Jangaon |
0.000 – 0.002 |
| Vidisha |
0.000 – 0.002 |
| Kasganj |
0.000 – 0.002 |
| Bhadohi |
0.000 – 0.002 |
| Kamrup Metropolitan |
0.000 – 0.002 |
| Angul |
0.000 – 0.002 |
| Bengaluru Rural |
0.000 – 0.002 |
| Pilibhit |
0.000 – 0.002 |
| Narsinghpur |
0.000 – 0.002 |
| Bidar |
0.000 – 0.002 |
| Muzaffarnagar |
0.000 – 0.002 |
| Medchal Malkajgiri |
0.000 – 0.002 |
| Aligarh |
0.000 – 0.002 |
| Longding |
0.000 – 0.002 |
| Begusarai |
0.000 – 0.002 |
| North 24 Parganas |
0.000 – 0.002 |
| South Garo Hills |
0.000 – 0.002 |
| Shimla |
0.000 – 0.002 |
| Phek |
0.000 – 0.002 |
| Satara |
0.000 – 0.002 |
| Champawat |
0.000 – 0.002 |
| Mainpuri |
0.000 – 0.002 |
| Jashpur |
0.000 – 0.002 |
| East Khasi Hills |
0.000 – 0.002 |
| Balasore |
0.000 – 0.002 |
| Bargarh |
0.000 – 0.002 |
| Hoshangabad |
0.000 – 0.002 |
| Tumakuru |
0.000 – 0.002 |
| Madhepura |
0.000 – 0.002 |
| Gariaband |
0.000 – 0.002 |
| Guna |
0.000 – 0.002 |
| Kaushambi |
0.000 – 0.002 |
| Cuttack |
0.000 – 0.002 |
| Datia |
0.000 – 0.002 |
| Bhopal |
0.000 – 0.002 |
| Chikkamagaluru |
0.000 – 0.002 |
| Mandi |
0.000 – 0.002 |
| Beed |
0.000 – 0.002 |
| Kodagu |
0.000 – 0.002 |
| Lepa Rada |
0.000 – 0.002 |
| Purba Bardhaman |
0.000 – 0.002 |
| Hnahthial |
0.000 – 0.002 |
| Dhar |
0.000 – 0.002 |
| Sivaganga |
0.000 – 0.002 |
| Ajmer |
0.000 – 0.002 |
| South West Garo Hills |
0.000 – 0.002 |
| Paschim Medinipur |
0.000 – 0.002 |
| Davanagere |
0.000 – 0.002 |
| Sangli |
0.000 – 0.002 |
| Bhagalpur |
0.000 – 0.002 |
| Sitapur |
0.000 – 0.002 |
| Dehradun |
0.000 – 0.002 |
| Jhansi |
0.000 – 0.002 |
| Dewas |
0.000 – 0.002 |
| Fatehpur |
0.000 – 0.002 |
| Etah |
0.000 – 0.002 |
| Hassan |
0.000 – 0.002 |
| Ballari |
0.000 – 0.002 |
| Tirunelveli |
0.000 – 0.002 |
| Amravati |
0.000 – 0.002 |
| Rewari |
0.000 – 0.002 |
| Shivamogga |
0.000 – 0.002 |
| Kurnool |
0.000 – 0.002 |
| Kalaburagi |
0.000 – 0.002 |
| Uttara Kannada |
0.000 – 0.002 |
| Majuli |
0.000 – 0.002 |
| Jagatsinghpur |
0.000 – 0.002 |
| Nandurbar |
0.000 – 0.002 |
| Mahabubabad |
0.000 – 0.002 |
| Kabeerdham |
0.000 – 0.002 |
| Belagavi |
0.000 – 0.002 |
| Etawah |
0.000 – 0.002 |
| Shivpuri |
0.000 – 0.002 |
| Fazilka |
0.000 – 0.002 |
| Wokha |
0.000 – 0.002 |
| Sehore |
0.000 – 0.002 |
| Y.S.R. Kadapa |
0.000 – 0.002 |
| Balod |
0.000 – 0.002 |
| Ratlam |
0.000 – 0.002 |
| Uttar Dinajpur |
0.000 – 0.002 |
| Bhadrak |
0.000 – 0.002 |
| Paschim Bardhaman |
0.000 – 0.002 |
| Sirmaur |
0.000 – 0.002 |
| Madurai |
0.000 – 0.002 |
| Surguja |
0.000 – 0.002 |
| Murshidabad |
0.000 – 0.002 |
| Amroha |
0.000 – 0.002 |
| Tiruchirappalli |
0.000 – 0.002 |
| Osmanabad |
0.000 – 0.002 |
| Rajnandgaon |
0.000 – 0.002 |
| Bhandara |
0.000 – 0.002 |
| Ballia |
0.000 – 0.002 |
| Shahjahanpur |
0.000 – 0.002 |
| Chandrapur |
0.000 – 0.002 |
| Indore |
0.000 – 0.002 |
| Bharatpur |
0.000 – 0.002 |
| Siddharthnagar |
0.000 – 0.002 |
| Ahmednagar |
0.000 – 0.002 |
| Prakasam |
0.000 – 0.002 |
| Subarnapur |
0.000 – 0.002 |
| Ujjain |
0.000 – 0.002 |
| Krishnagiri |
0.000 – 0.002 |
| Kangra |
0.000 – 0.002 |
| Porbandar |
0.000 – 0.002 |
| S.P.S. Nellore |
0.000 – 0.002 |
| Sagar |
0.000 – 0.002 |
| Virudhunagar |
0.000 – 0.002 |
| Ramanathapuram |
0.000 – 0.002 |
| Raigad |
0.000 – 0.002 |
| Gondia |
0.000 – 0.002 |
| Bijnor |
0.000 – 0.002 |
| Koppal |
0.000 – 0.002 |
| Yavatmal |
0.000 – 0.002 |
| Jamnagar |
0.000 – 0.002 |
| Meerut |
0.000 – 0.002 |
| South Salmara Mankachar |
0.000 – 0.002 |
| Auraiya |
0.000 – 0.002 |
| Ghazipur |
0.000 – 0.002 |
| Sheikhpura |
0.000 – 0.002 |
| Washim |
0.000 – 0.002 |
| Aurangabad |
0.000 – 0.002 |
| Ashoknagar |
0.000 – 0.002 |
| Jalaun |
0.000 – 0.002 |
| Mungeli |
0.000 – 0.002 |
| Wardha |
0.000 – 0.002 |
| Purnia |
0.000 – 0.002 |
| Bhind |
0.000 – 0.002 |
| Jalgaon |
0.000 – 0.002 |
| Jhajjar |
0.000 – 0.002 |
| Jalna |
0.000 – 0.002 |
| South Goa |
0.000 – 0.002 |
| Patna |
0.000 – 0.002 |
| West Garo Hills |
0.000 – 0.002 |
| Sambhal |
0.000 – 0.002 |
| Dindigul |
0.000 – 0.002 |
| Bastar |
0.000 – 0.002 |
| Puri |
0.000 – 0.002 |
| Budaun |
0.000 – 0.002 |
| Harda |
0.000 – 0.002 |
| Jaipur |
0.000 – 0.002 |
| Arwal |
0.000 – 0.002 |
| Birbhum |
0.000 – 0.002 |
| Akola |
0.000 – 0.002 |
| Surendranagar |
0.000 – 0.002 |
| Botad |
0.000 – 0.002 |
| Dharwad |
0.000 – 0.002 |
| Firozabad |
0.000 – 0.002 |
| Nagpur |
0.000 – 0.002 |
| Hathras |
0.000 – 0.002 |
| Jabalpur |
0.000 – 0.002 |
| Kanpur Nagar |
0.000 – 0.002 |
| Raigarh |
0.000 – 0.002 |
| Maharajganj |
0.000 – 0.002 |
| Mandya |
0.000 – 0.002 |
| Theni |
0.000 – 0.002 |
| Shopiyan |
0.000 – 0.002 |
| Mysuru |
0.000 – 0.002 |
| Nashik |
0.000 – 0.002 |
| Dakshina Kannada |
0.000 – 0.002 |
| Bhavnagar |
0.000 – 0.002 |
| Mau |
0.000 – 0.002 |
| Una |
0.000 – 0.002 |
| Bagalkote |
0.000 – 0.002 |
| Buldhana |
0.000 – 0.002 |
| Morena |
0.000 – 0.002 |
| Hingoli |
0.000 – 0.002 |
| Longleng |
0.000 – 0.002 |
| Balrampur |
0.000 – 0.002 |
| Dang |
0.000 – 0.002 |
| Baloda Bazar |
0.000 – 0.002 |
| Rajgarh |
0.000 – 0.002 |
| Pune |
0.000 – 0.002 |
| Mokokchung |
0.000 – 0.002 |
| Dharmapuri |
0.000 – 0.002 |
| Ariyalur |
0.000 – 0.002 |
| Mandsaur |
0.000 – 0.002 |
| Anantnag |
0.000 – 0.002 |
| Zunheboto |
0.000 – 0.002 |
| Tikamgarh |
0.000 – 0.002 |
| Gomati |
0.000 – 0.002 |
| Agra |
0.000 – 0.002 |
| Aizawl |
0.000 – 0.002 |
| Budgam |
0.000 – 0.002 |
| Uttar Bastar Kanker |
0.000 – 0.002 |
| Patan |
0.000 – 0.002 |
| Mahendragarh |
0.000 – 0.002 |
| Varanasi |
0.000 – 0.002 |
| Saharanpur |
0.000 – 0.002 |
| Malappuram |
0.000 – 0.002 |
| Hooghly |
0.000 – 0.002 |
| Udaipur |
0.000 – 0.002 |
| Rampur |
0.000 – 0.002 |
| Dausa |
0.000 – 0.002 |
| Chittoor |
0.000 – 0.002 |
| Haridwar |
0.000 – 0.002 |
| Ghaziabad |
0.000 – 0.002 |
| Sri Muktsar Sahib |
0.000 – 0.002 |
| Namakkal |
0.000 – 0.002 |
| Nadia |
0.000 – 0.002 |
| West Jaintia Hills |
0.000 – 0.002 |
| Kendrapara |
0.000 – 0.002 |
| Warangal Rural |
0.000 – 0.002 |
| Baghpat |
0.000 – 0.002 |
| Palwal |
0.000 – 0.002 |
| Latur |
0.000 – 0.002 |
| Sonipat |
0.000 – 0.002 |
| Bishnupur |
0.000 – 0.002 |
| Amreli |
0.000 – 0.002 |
| Jehanabad |
0.000 – 0.002 |
| Howrah |
0.000 – 0.002 |
| Nanded |
0.000 – 0.002 |
| Dadra and Nagar Haveli |
0.000 – 0.002 |
| Wayanad |
0.000 – 0.002 |
| Farrukhabad |
0.000 – 0.002 |
| Imphal East |
0.000 – 0.002 |
| Sheohar |
0.000 – 0.002 |
| Dakshin Dinajpur |
0.000 – 0.002 |
| Khordha |
0.000 – 0.002 |
| Dhalai |
0.000 – 0.002 |
| Visakhapatnam |
0.000 – 0.002 |
| Imphal West |
0.000 – 0.002 |
| Jalpaiguri |
0.000 – 0.002 |
| Thane |
0.000 – 0.002 |
| Parbhani |
0.000 – 0.002 |
| Durg |
0.000 – 0.002 |
| Jind |
0.000 – 0.002 |
| Kondagaon |
0.000 – 0.002 |
| Rajkot |
0.000 – 0.002 |
| Banaskantha |
0.000 – 0.002 |
| Kasaragod |
0.000 – 0.002 |
| Sirsa |
0.000 – 0.002 |
| Bulandshahr |
0.000 – 0.002 |
| Gadag |
0.000 – 0.002 |
| Idukki |
0.000 – 0.002 |
| Vizianagaram |
0.000 – 0.002 |
| Hisar |
0.000 – 0.002 |
| Haveri |
0.000 – 0.002 |
| Kolar |
0.000 – 0.002 |
| East Godavari |
0.000 – 0.002 |
| Guntur |
0.000 – 0.002 |
| Gautam Buddha Nagar |
0.000 – 0.002 |
| Bharuch |
0.000 – 0.002 |
| Baramulla |
0.000 – 0.002 |
| Srikakulam |
0.000 – 0.002 |
| Pulwama |
0.000 – 0.002 |
| Rohtak |
0.000 – 0.002 |
| Bhiwani |
0.000 – 0.002 |
| Darjeeling |
0.000 – 0.002 |
| Salem |
0.000 – 0.002 |
| Cooch Behar |
0.000 – 0.002 |
| Fatehabad |
0.000 – 0.002 |
| Shamli |
0.000 – 0.002 |
| Bametara |
0.000 – 0.002 |
| Narmada |
0.000 – 0.002 |
| Tiruvannamalai |
0.000 – 0.002 |
| North Tripura |
0.000 – 0.002 |
| Jiribam |
0.000 – 0.002 |
| Khowai |
0.000 – 0.002 |
| Alwar |
0.000 – 0.002 |
| Kohima |
0.000 – 0.002 |
| Thanjavur |
0.000 – 0.002 |
| Ahmedabad |
0.000 – 0.002 |
| Udham Singh Nagar |
0.000 – 0.002 |
| Hoshiarpur |
0.000 – 0.002 |
| Kathua |
0.000 – 0.002 |
| Cuddalore |
0.000 – 0.002 |
| Nuh |
0.000 – 0.002 |
| Solan |
0.000 – 0.002 |
| Rupnagar |
0.000 – 0.002 |
| West Tripura |
0.000 – 0.002 |
| Kollam |
0.000 – 0.002 |
| Junagadh |
0.000 – 0.002 |
| Thoubal |
0.000 – 0.002 |
| Kakching |
0.000 – 0.002 |
| Palakkad |
0.000 – 0.002 |
| South Tripura |
0.000 – 0.002 |
| Nagapattinam |
0.000 – 0.002 |
| West Godavari |
0.000 – 0.002 |
| Kannur |
0.000 – 0.002 |
| Pathanamthitta |
0.000 – 0.002 |
| Kaithal |
0.003 – 0.004 |
| Dahod |
0.003 – 0.004 |
| Pathankot |
0.003 – 0.004 |
| Bengaluru Urban |
0.003 – 0.004 |
| Mahasamund |
0.003 – 0.004 |
| Navsari |
0.003 – 0.004 |
| Ganganagar |
0.003 – 0.004 |
| Hamirpur |
0.003 – 0.004 |
| Dhamtari |
0.003 – 0.004 |
| South Sikkim |
0.003 – 0.004 |
| Kozhikode |
0.003 – 0.004 |
| Dimapur |
0.003 – 0.004 |
| East Sikkim |
0.003 – 0.004 |
| Janjgir Champa |
0.003 – 0.004 |
| Karnal |
0.003 – 0.004 |
| Mehsana |
0.003 – 0.004 |
| Kottayam |
0.003 – 0.004 |
| Faridkot |
0.003 – 0.004 |
| Krishna |
0.003 – 0.004 |
| Kurukshetra |
0.003 – 0.004 |
| Raipur |
0.003 – 0.004 |
| Kapurthala |
0.003 – 0.004 |
| Unokoti |
0.003 – 0.004 |
| Bilaspur |
0.003 – 0.004 |
| Amritsar |
0.003 – 0.004 |
| Khammam |
0.003 – 0.004 |
| Ranga Reddy |
0.003 – 0.004 |
| Thrissur |
0.003 – 0.004 |
| Valsad |
0.003 – 0.004 |
| Shajapur |
0.003 – 0.004 |
| Yamunanagar |
0.003 – 0.004 |
| Coimbatore |
0.003 – 0.004 |
| Nizamabad |
0.003 – 0.004 |
| Thiruvarur |
0.003 – 0.004 |
| Ferozepur |
0.003 – 0.004 |
| Ernakulam |
0.003 – 0.004 |
| Panchkula |
0.003 – 0.004 |
| Warangal Urban |
0.003 – 0.004 |
| Panipat |
0.003 – 0.004 |
| Gurugram |
0.003 – 0.004 |
| Anand |
0.003 – 0.004 |
| Gandhinagar |
0.003 – 0.004 |
| Panchmahal |
0.003 – 0.004 |
| Kanyakumari |
0.003 – 0.004 |
| Patiala |
0.003 – 0.004 |
| Erode |
0.003 – 0.004 |
| Viluppuram |
0.003 – 0.004 |
| Tarn Taran |
0.003 – 0.004 |
| Sabarkantha |
0.003 – 0.004 |
| Sipahijala |
0.003 – 0.004 |
| Adilabad |
0.003 – 0.004 |
| Ambala |
0.003 – 0.004 |
| Nalgonda |
0.003 – 0.004 |
| Kota |
0.005 – 0.016 |
| Kheda |
0.005 – 0.016 |
| Faridabad |
0.005 – 0.016 |
| Jammu |
0.005 – 0.016 |
| Fatehgarh Sahib |
0.005 – 0.016 |
| North Goa |
0.005 – 0.016 |
| Srinagar |
0.005 – 0.016 |
| Vadodara |
0.005 – 0.016 |
| Moga |
0.005 – 0.016 |
| S.A.S. Nagar |
0.005 – 0.016 |
| Vellore |
0.005 – 0.016 |
| Delhi |
0.005 – 0.016 |
| Thiruvananthapuram |
0.005 – 0.016 |
| Shahid Bhagat Singh Nagar |
0.005 – 0.016 |
| Gurdaspur |
0.005 – 0.016 |
| Chennai |
0.005 – 0.016 |
| Medak |
0.005 – 0.016 |
| Karaikal |
0.005 – 0.016 |
| Ludhiana |
0.005 – 0.016 |
| Surat |
0.005 – 0.016 |
| Bathinda |
0.005 – 0.016 |
| Sangrur |
0.005 – 0.016 |
| Kancheepuram |
0.005 – 0.016 |
| Mumbai |
0.005 – 0.016 |
| Mansa |
0.005 – 0.016 |
| Alappuzha |
0.005 – 0.016 |
| Barnala |
0.005 – 0.016 |
| Jalandhar |
0.005 – 0.016 |
| Puducherry |
0.005 – 0.016 |
| Mahabubnagar |
0.005 – 0.016 |
| Chandigarh |
0.005 – 0.016 |
| Karimnagar |
0.005 – 0.016 |
| Diu |
0.017 – 0.048 |
| Kolkata |
0.017 – 0.048 |
| Yanam |
0.017 – 0.048 |
| Daman |
0.017 – 0.048 |
| Lakshadweep |
0.017 – 0.048 |
| Hyderabad |
0.017 – 0.048 |
| Mahe |
> 0.048 |