How the TARINA program is tracking the role of local markets in smallholder diets in India
Diversified food consumption is important for improving the nutritional status of the population in all age groups. Several factors like price, availability, traditional tastes and preferences play a key role in determining how households allocate their food budget to different food groups and food items. In rural areas, where markets are less developed, the consumption of diversified foods is mainly dependent on local production systems. However, as economies transition and incomes grow households undergo a separation of production and consumption decisions. In other words, farming households need not necessarily rely on own- production for their consumption needs. Rather, they become increasingly more reliant on local markets as a source of income and therefore food. While recent literature has highlighted the role that production diversity can play in improved nutritional outcomes that association is increasingly being challenged in regions where households are better integrated into local markets. For such households markets play an important role, not just as a source of income but also as source of diverse, nutritious and affordable foods throughout the year. This is reflected in the findings of the TARINA baseline survey as well, that indicates households primarily rely on markets for the purchase of non- staple foods (figure 1).
Figure 1: Sources of access to non-staple food groups throughout the year
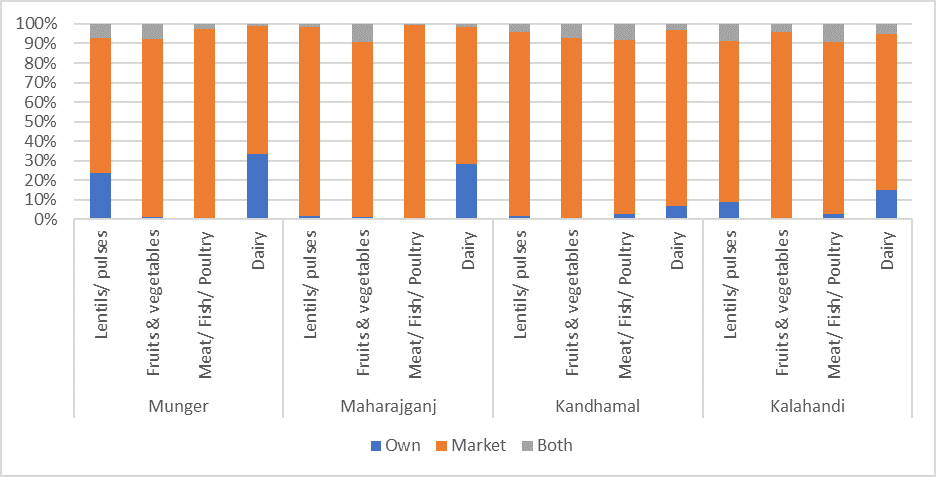
Source: TCI-TARINA: Baseline Survey Data (2016-17)- unpublished
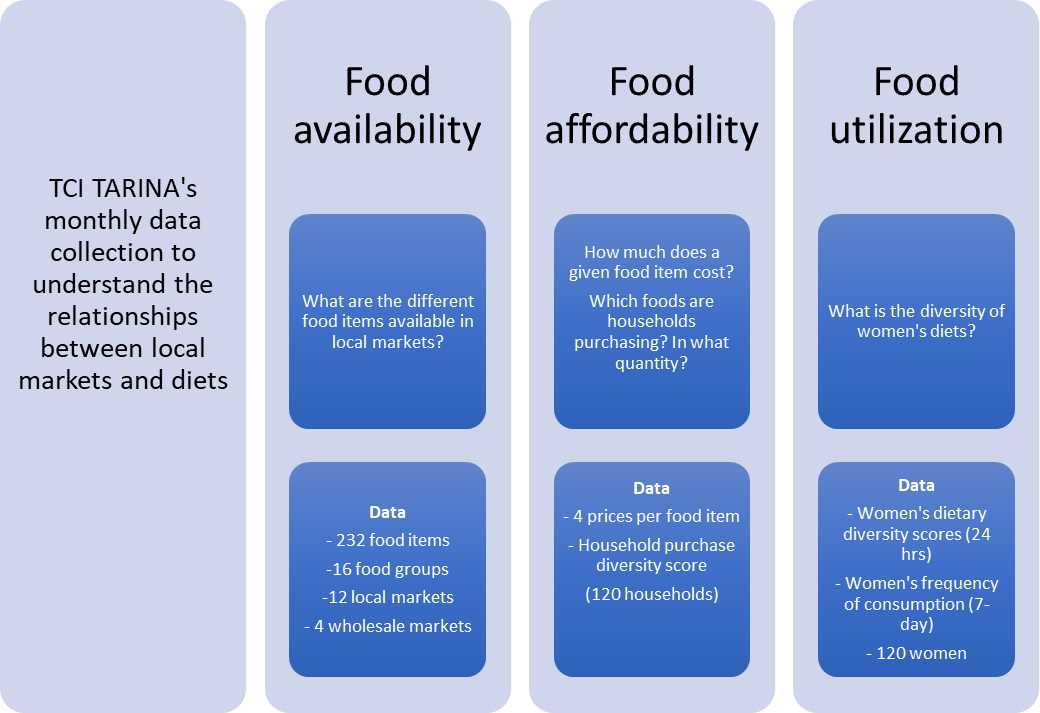
It is in this context that TCI’s TARINA program introduced a Market Diversity Study (MDS) in its four program locations – Munger (Bihar), Maharajganj (Uttar Pradesh) and Kandhamal and Kalahandi (Odisha) – in 2017. While the first round of data from the MDS yielded detailed information on the availability of a total of nearly 250 different food items across 12 local markets, we realized that a cross- sectional insight into market diversity was not without its limitations. Accordingly, in 2018- 19 the frequency of the MDS was expanded and data was collected on a monthly basis – not just on food availability but also food prices – for the same set of 12 weekly markets as in round 1. In addition to the increased frequency the scope of the MDS was also expanded to include not just local weekly village- markets but also wholesale markets (one in each district). Moreover, this data on markets was complemented with data on women’s dietary intake and household- level food purchases, also on a monthly basis, from a sample of 120 households across the four program districts. Women’s dietary intake was assessed using two different recall periods to allow for changes in day- to- day consumption: 24 hours and 7- days. Taken together the monthly data on the MDS and women’s diets will provide us with a comprehensive picture of the availability (in terms of diversity), affordability (in terms of market price and household food purchases) and utilization (in terms of dietary intake) of foods by smallholder farming households from the local markets. Figure 1 summarizes these aspects of TCI TARINA’s study on markets and diets.
Figure 2: TCI- TARINA’s study on markets and diets
A Market Diversity Score was constructed as a simple count of the total number of food groups available in a market. These food groups were : (Grains, Pulses (beans, peas & lentils), Nut & seeds, Dairy, Meat, poultry & fish, Eggs, Dark Green leafy vegetables, Vitamin A-rich fruits & vegetables, Other vegetables, Other fruits, Other oils & fats, Savoury & fried snacks, Sweets, Sugar-sweetened beverages, Condiments & seasonings, Other beverages and foods).Preliminary results from the first round of the MDS indicate that in all locations local markets were supplying all the food groups under consideration (figure 3).
Figure 3: Food availability from local markets
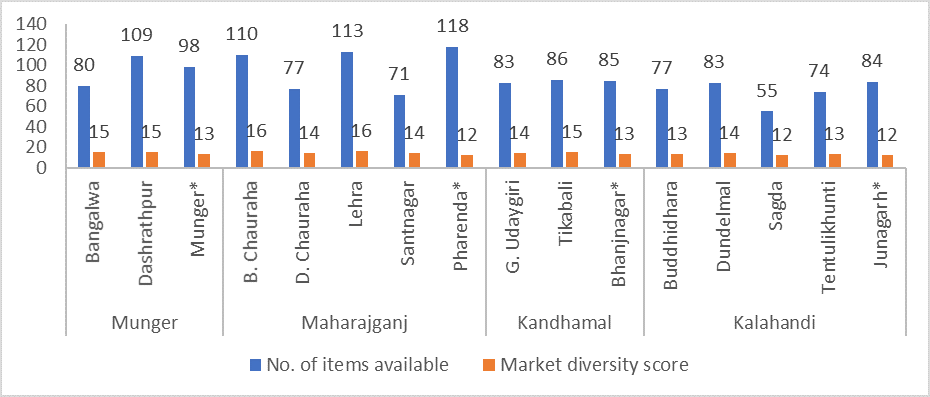
Source: TCI-TARINA: Preliminary results from TARINA MDS data (June – November 2018) – unpublished. Market Diversity Score refers to the count of food groups (0-16) available in the market. * indicates wholesale market
A look at the patterns of household food purchase and consumption suggests that as households are able to purchase a greater number (and therefore diversified basket) of food groups from local markets, women’s dietary intake is characterized by a more diverse diet (figure 4).
Figure 4: Understanding women’s dietary diversity vis a vis market food purchases
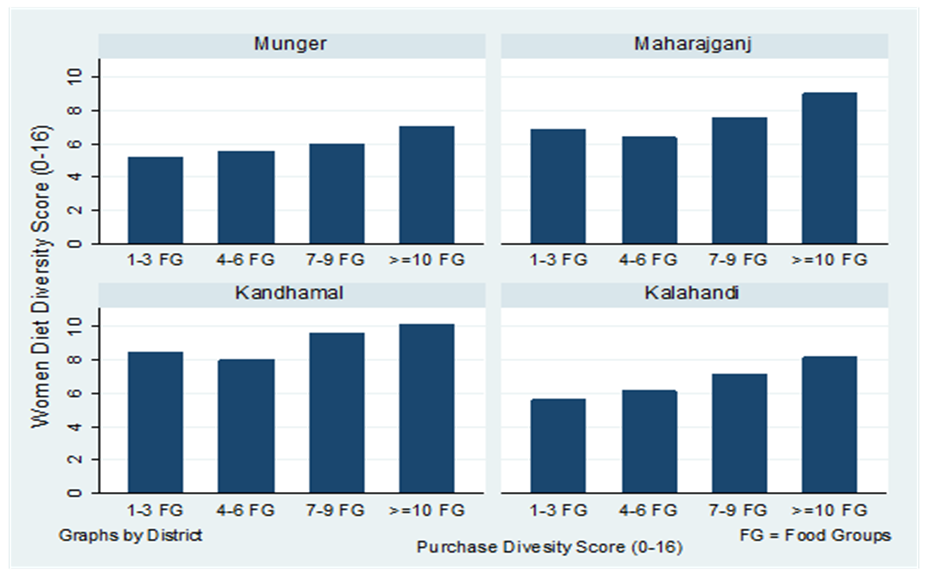
Source: TCI-TARINA: Preliminary results from TARINA MDS data (June – November 2018) – unpublished
Women’s Dietary Diversity Score refers to the count of food groups (0-16) consumed by the woman in the previous 24- hours. Purchase Diversity Score refers to the number of food groups (0-16) purchased by the household in the previous 7 days.
As the data collection for the monthly TARINA study on diets and markets winds up in June 2019 we expect to gain further insights into the relationships between markets and diets, the role of seasonality as well as the role of prices in influencing women’s nutritional outcomes.
-Soumya Gupta & Dhiraj Singh