Assessing India’s FPO Ecosystem
This blog post is part of a series exploring India’s small farm aggregation landscape using TCI’s Database for Indian Farmer Producer Organizations (FPOs). Part of the FPO Hub within the TCI Center of Excellence, the first-of-its-kind database brings together comprehensive data on FPOs in India. The FPO Hub and this research were made possible through grant funding from the Walmart Foundation.
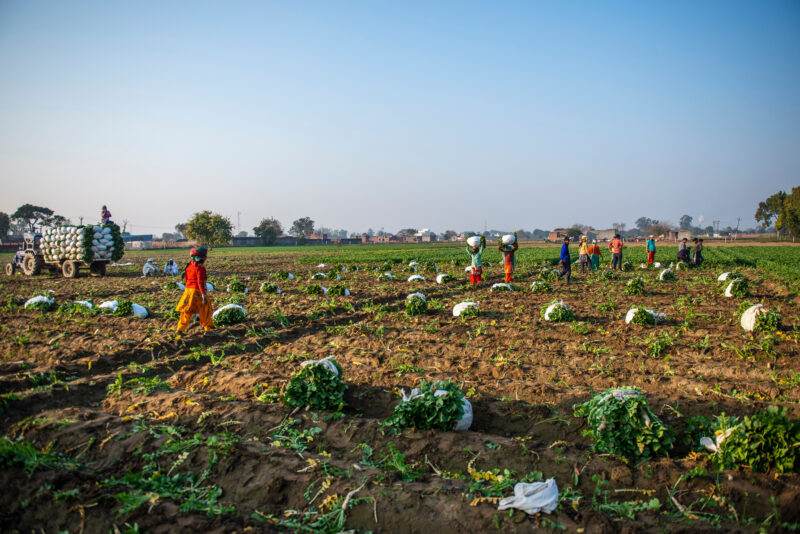
Taken together, small and marginal holdings (below 2 hectares) constitute 85 percent of the farming community in India. Small farmers face various farm- and household-specific transaction costs, limiting their ability to participate in input and product markets. As food preferences change toward a diversified, higher-quality diet due to income and population growth, small-farm commercialization is crucial to meet this rising demand.
Aggregation models are potential institutional interventions that help redress the constraints of small farms, wherein groups of producers jointly manage resources or access credit, inputs, information, and product markets to reduce transaction costs. Successful aggregation models have shown increasing economies of scale, decreased transaction and coordination costs, improved access to markets, and investment in yield-stabilizing technologies like irrigation and improved crop varieties to be the main benefits of organizing farmers.
In the past, cooperatives were the most common form of aggregation model in rural India. With the exceptions of dairy and sugar, cooperatives in India have been mostly ineffective due to issues involving incompetent management, political interference, financial irregularities, and corruption within the organizations. Poor management also made many cooperatives dependent on government funds for working capital. Cooperatives mandated government representation on their governing boards, allowing political interference in their functioning which further hindered growth.
After the amendment of the Companies Act in 2003, farmer Producer Organizations (FPOs) emerged as a new form of aggregation model in India. Owing to a hybrid business model (between a private company and a cooperative), the new institutional form of FPOs limits membership to only primary producers who contribute equitably to the working capital and democratically control the FPO, sharing equal voting rights. Thus, being structurally different in membership, governance, and business model from cooperatives, FPOs are viewed as an advantageous alternative to cooperatives, with the key purpose of facilitating smallholder commercialization and increasing farm incomes.
Government agencies like the Small Farmer Agribusiness Consortium (SFAC) and National Bank for Agriculture and Rural Development (NABARD) were appointed as the nodal agencies for the mobilization and promotion of FPOs. Civil society organizations and national and international funding organizations have also emerged to promote and help develop FPOs into sustainable farmer enterprises. FPOs are provided financial assistance in the form of grants from the government for a period of three years with additional provision for matching equity grants and collateral-free loans. Along with the share capital of FPOs, these funds can be utilized to meet infrastructure and working capital needs, and to pay administrative costs and salaries in the growing phase. In addition, most central and state schemes for supporting agriculture now include special provisions for promoting and nurturing FPOs.
Thanks to a strong push from the central government, thousands of FPOs have been registered in the last decade. However, questions regarding their status and characteristics like geographical spread, membership patterns, and financial attributes remain largely unanswered. A greater understanding of the performance and viability of these organizations is needed as the Indian government plans to set up and support 10,000 new FPOs over the next five years through the newly approved central sector scheme.
As the only centralized source of data on Indian FPOs currently available, TCI’s FPO database is the first step toward filling the crucial gaps in our understanding of India’s FPO ecosystem.
As part of its Center of Excellence in New Delhi, the Tata-Cornell Institute (TCI) FPO Hub aims to support the promotion of effective FPO models in India. Its first-of-its-kind Database for Indian FPOs provides full information on more than 4,000 FPOs within an overall environment of 16,811 FPOs registered in India in the last 21 years, from 2004 until July 2021.
Emergence and density of FPOs
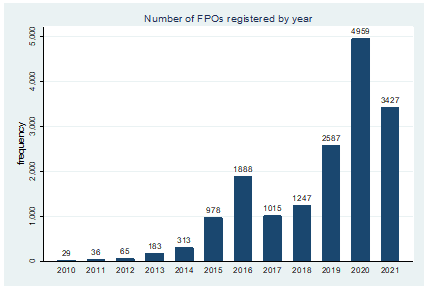
Most of the FPOs formed in the past two decades were registered after 2014, which aligns with the more favorable policy environment created by a massive push for FPO promotion through various central and state government schemes. The largest spike occurred in the last three years, during which time 65 percent of FPOs were registered.
See Tables below for data in table form.
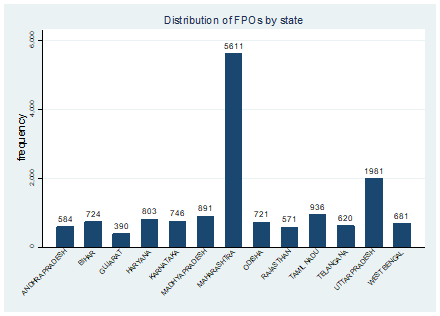
The number of FPOs registered varies widely across states. Six states account for two-thirds of the total FPOs registered in the country, with Maharashtra alone accounting for one-third. This can be partly attributed to the state’s successful history of agricultural cooperatives and structural marketing reforms.
See Tables below for data in table form.
Apart from Maharashtra, Bihar, Odisha, Tamil Nadu, West Bengal, and Uttar Pradesh have reported the highest increase in the number of FPOs registered in the last three years. In addition to government budget provisions for promoting and nurturing FPOs, the Odisha government has roped in international agencies to develop a market ecosystem for them. Similarly, the Tamil Nadu government announced special incentives and concessions to promote FPOs in the state. The rising number of FPOs in Uttar Pradesh can be attributed to the state’s exclusive policy on FPOs, which aims to set up at least one FPO in every block. The Uttar Pradesh government also launched the first FPO portal to bring farmers, producer groups, traders, the Department of Agriculture, and other allied departments of the state government on one platform.
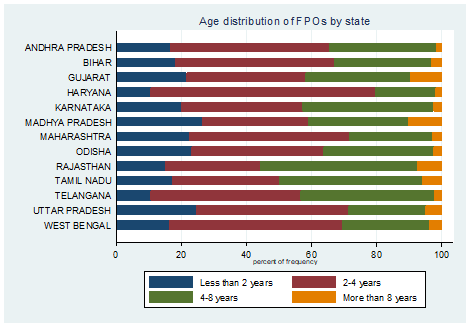
The age of FPOs varies from 1 to 18 years. Forty-five percent of the FPOs are between 2 and 4 years old, followed by 30 percent of FPOs aged between 4 and 8 years. Only 4 percent of the FPOs (710) are older than 8. This pattern is true for most FPO-dense states. Madhya Pradesh, Gujarat, Rajasthan, and Tamil Nadu have a larger percentage of FPOs more than 8 years old compared to other states. Madhya Pradesh was among the first states to start promoting FPOs under the District Poverty Initiative Program (DPIP) by bringing together existing common interest groups of farmers.
See Tables below for data in table form.
Since FPOs are registered under the Companies Act, they are required to follow the legal requirements under these laws, called statutory compliances. Strong and transparent governance in these organizations can ensure the timely filing of compliance documents. Our data reveals that about one-third of FPOs (32.8 percent) are active non-compliant, which attracts penalties and could be a reasonable cause to believe that the company is not carrying out any business operations. Noncompliance with annual returns and financial statements for the preceding 3 years can lead to the FPO being “struck off” by the Ministry of Corporate Affairs.
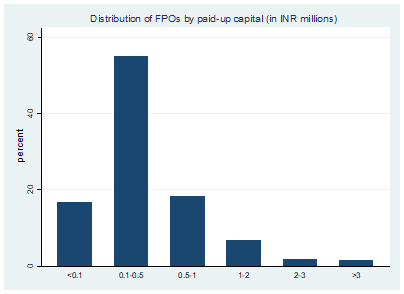
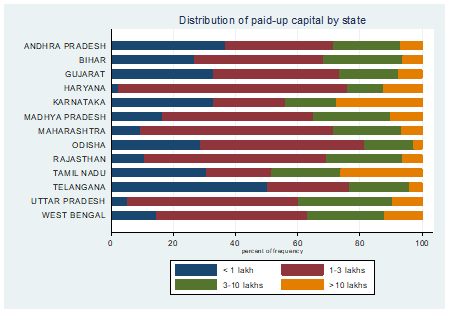
Paid-up capital (PUC) forms an integral part of an FPO’s viability as an indicator of a company’s scale of operations and attractiveness of investment. A higher PUC is indicative of a company’s ability to conduct sustained operations, investment in inventory and fixed assets, enhancement of value addition activities, and ability to raise working capital.
As per our database, registered FPOs in India have a total PUC of about INR 12.6 billion, with a median of INR 1 lakh per FPO. The distribution of PUC is heavily skewed towards a few FPOs with very large PUC (above INR 10 lakhs), while about 75 percent have less than 5 lakhs.
See Tables below for data in table form.
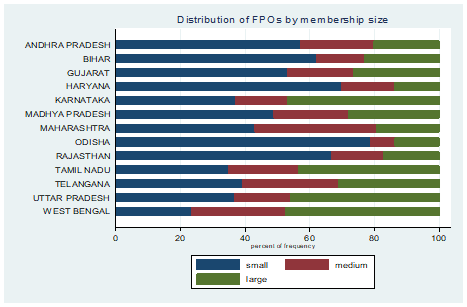
A subsample of 3,190 FPOs with shareholder information reveals that the average number of members in an FPO is around 470. The total number of farmer-members served by these 3,190 FPOs across states is 1.5 million. The median number of shareholders ranges from 10 in Haryana, Odisha, and Rajasthan, to above 400 in Karnataka, West Bengal, and Tamil Nadu. Forty-seven percent of the FPOs are categorized as small-sized, with less than 100 farmer-members, while 28 percent are considered to be large, with more than 500 members. This pattern is consistent across most states. States like West Bengal, Tamil Nadu, Maharashtra, Karnataka, and Uttar Pradesh have overwhelmingly high numbers of large FPOs.
See Tables below for data in table form.
Directly corresponding to the size of FPOs, states like Karnataka, Tamil Nadu, Uttar Pradesh, and West Bengal with larger numbers of farmer-members have higher PUC on average compared to other states. Though, differences in the implementing agency (NABARD SFAC, NRLM, etc.) and the socioeconomic characteristics of farmer-members could also lead to differences. A majority of PUCs are capital constrained with a working capital of less than INR 3 lakhs.
See Tables below for data in table form.
Why an FPO database?
As the only centralized source of data on Indian FPOs currently available, TCI’s FPO database is the first step toward filling the crucial gaps in our understanding of India’s FPO ecosystem. Bringing together information on thousands of FPOs, this robust database plays a crucial role in evidence-informed policymaking for future scaling. It will also facilitate the development of metrics to assess organizational performance, which influences the ability of FPOs to enhance farmer livelihoods.
Ekta Joshi is a TCI scholar and PhD student studying applied economics and management at Cornell University.
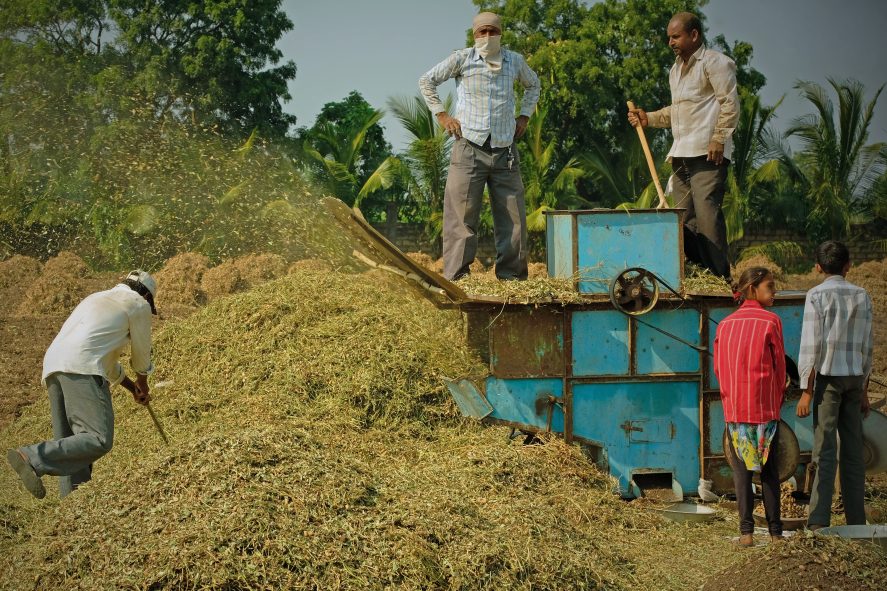
Featured image: Smallholder farmers operate a thresher during the peanut harvest in Gujarat, India. (Photo by pjhpix on Shutterstock)