Seven Charts That Explain Why Some FPOs Succeed While Others Fail
Farmer producer organization (FPO) growth is at its highest rate ever. An explosive 35,332 farmer producer companies (FPCs) have been promoted over the last five years, and annual agricultural producer cooperative (APC) promotion is at 6,000 cooperatives a year, the highest 10-year average in its 125-year history. New government investment has made FPOs a central agricultural development strategy for smallholder farmers.
But for this strategy to be viable, FPOs need to be sustainable. So far, we have little understanding of what factors influence why FPOs remain functional over time. In order to capitalize on this burst of promotion for India’s agricultural development and farmers’ livelihoods, it is crucial to understand what makes an FPO sustainable once government support expires.
In TCI’s recent report, “The State of Farmer Producer Organizations in India: Performance, Trends, and the Role of Gender,” we provided the first comprehensive, nationwide analysis of India’s FPOs, drawing on data from the FPO Platform for India. Prior to our assessment, the number of FPOs in India had been largely unknown due to the lack of a centralized database to monitor FPO promotion and activities.
One of the main questions driving our analysis was, “How many FPOs continue to function on their own after their 3–5 year government support period has concluded?” Through our analysis, we learned that, as of September 2024, India had promoted 44,547 FPCs and 214,797 APCs. Between 4,007–11,429 FPCs continue to function beyond their government support period, a rate of 43–49%; 154,490 APCs continue to function, for a rate of 72%.
Further analysis sheds light on some of the factors influencing functionality for these two types of FPOs. Let’s delve into the numbers and explore some of the characteristics that may influence these functionality rates.
Farmer producer company functionality rates decline as they age and stabilize around 30%
- FPC functionality rates decline over an eight-year period from just above 50% until they stabilize around 30%.
- It will be important to see if these trends hold. The years with 30% functionality are prior to 2014, when there were very few FPCs incorporated. FPC promotion started to take off following the new Company Act of 2013.
Agricultural producer cooperative functionality rates are consistently between 60–80%
- The functionality status of APCs is consistently around 70%, regardless of the year in which they were promoted.
States with a greater number of farmer producer companies have higher functionality rates
- States with the most FPCs three years old or more all maintain functional FPCs at a rate of 50% or more, with the exception of Bihar (38%) and Assam (37%).
- Most smaller states have difficulty maintaining functional FPCs, with rates varying between 0–40%.
Agricultural producer cooperative functionality rates vary widely across states
- Tamil Nadu leads with 95% functionality, followed by Gujarat (91%), Telangana (91%) and Karnataka (89%).
- Uttar Pradesh manages only 36% functionality, despite having the second largest number of incorporated cooperatives, and Haryana achieves just 39%.
Agricultural producer cooperative functionality also varies by sector within states
- Cooperative performance varies strongly by sector and most states have difficulties maintaining strong performance across all sectors.
- Farmer service societies maintain consistently high functionality across states, while dairy cooperatives show strong but variable performance.
- Fishery, sericulture and agriculture and allied activity cooperatives show moderate but variable performance.
- Sugar mills, livestock, and poultry, and bee farming cooperatives demonstrate the greatest interstate variation, with some states achieving excellent results while others struggle significantly.
Female-led and mixed leadership farmer producer companies maintain higher functionality rates than male-led companies
- Mixed and female-led FPCs show consistently higher levels of functionality than male-led FPCs incorporated in the same year.
- Overall, 75–80% of mixed FPCs and 71–75% of female-led FPCs continue to operate beyond their support period compared to 66–67% of male-led FPCs.
Older functional farmer producer companies tend to be larger
- FPCs over 5 years old are consistently larger than medium and small FPCs.
What leads to longevity for farmer producer companies and agricultural producer cooperatives?
Analyzing the 259,344 FPOs promoted in India provides us with some indications of the characteristics that lead to longevity for FPCs and APCs.
Farmer producer companies
- Female leadership is associated with FPC sustainability over time. Gender leadership correlates with FPC functionality. If the proportion of women in leadership is equal to or greater than men, functionality rates are higher.
- Large FPCs are associated with FPC sustainability over time. Based on the data, we are unable to say whether these FPCs were large when they were incorporated or grew over time, but it is clear that having a large membership means an FPC is more likely to remain functional over time.
- FPCs have relatively consistent functionality rates across states, to a point. States with more than 50 FPCs are relatively immune to differences in state capacity and support. The exceptions are states with few FPCs, which have functionality rates that vary considerably. States may require a critical mass of FPCs or a higher capacity to support agricultural programs in order to achieve FPC sustainability.
- FPC functionality rates drop over time. FPC functionality rates decline each year after incorporation until they stabilize around 30%.
Agricultural Producer Cooperatives
- APCs have relatively consistent functionality over time. Regardless of the year incorporated, approximately 70% of cooperatives stay functional. Unlike FPCs, APCs do not show as large a decline in functionality over time, if at all.
- APCs have varying functionality across states. Substantial interstate variation in functionality indicates that cooperative success depends heavily on state-level institutional capacity and policy support.
- States have a difficult time performing well across all APC sectors. Almost all states perform well in some sectors and struggle in others in terms of sustaining APC functionality, indicating varying levels of capacity and support by sectors within specific states.
These functionality indicators provide an idea of what characteristics matter most for FPO longevity, after government support is finished, under India’s current FPC and APC policy and development schemes: gender composition, size and state capacity. In addition to providing direction for future research, they can also help atune practitioners and policymakers to some of the dynamics affecting FPOs, as well as which programmatic and policy levers might better strengthen FPOs over time.
Dieter Bouma is a research support specialist at TCI.
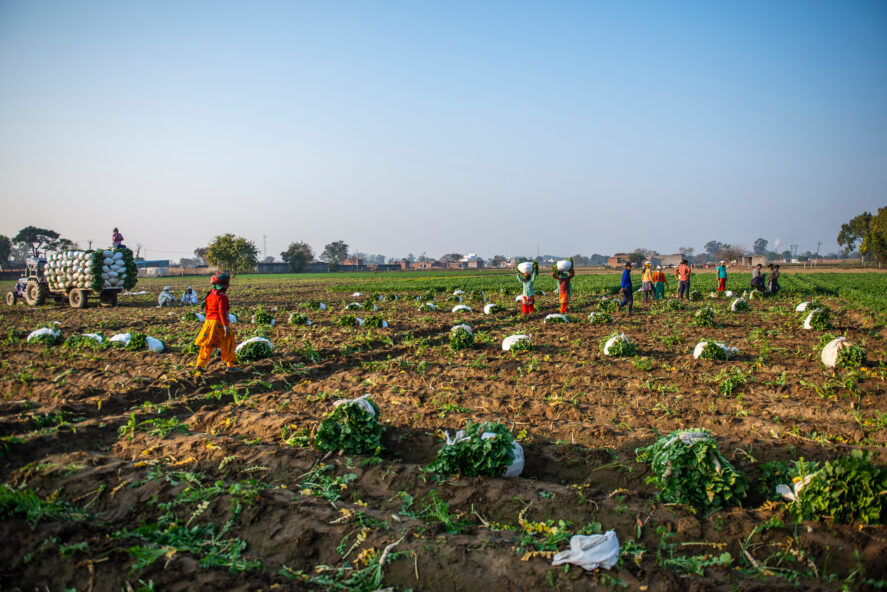
Featured image: A group of women harvests radishes in Uttar Pradesh, India. (Photo by Pradeep Gaurs/Shutterstock)